Joseph K. Myers. 12-18-05. minF, improved curve fitting for quadratic regression.
We consider the function y(x) = cx. Given a set of points p = (x_i, y_i), we want to minimize the functional:
F(y) = d2(y, p).
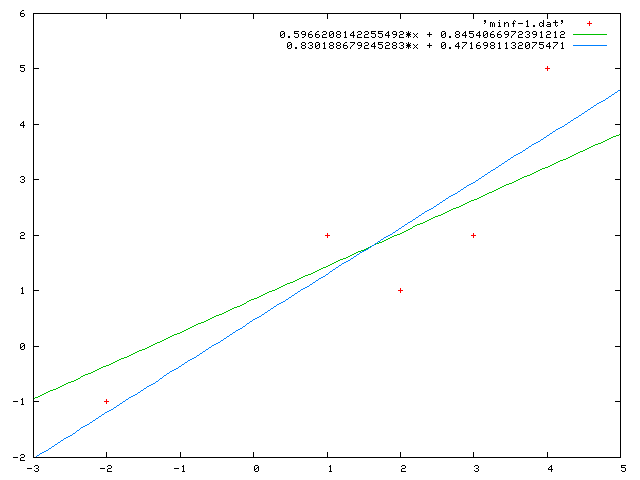
An example:
 x  y
-2 -1
 1  2
 2  1
 3  2
 4  5
If we use Calculus to find the value of c which minimizes F, we obtain a line which is closer to the points, where closeness is not measured only in the vertical sense, but rather in the direction normal to function y(x). Thus, our sense of minimization is more similar to minimizing the distance between sets, or to maintaining stability of computation between the predictor and the data.
See the Appendix for our calculations.
Our curve fit is now obtained:
If we use Gaussian least-squares quadratic regression to find a curve fit of the form y = mx + b, e.g., lsr.html, we obtain y = 0.8301886792452831x + 0.4716981132075471. When we plug this y into F, we obtain its total value of minimization:
Clearly, we have reduced the distance to the line from the data, and the solutions are graphed below.
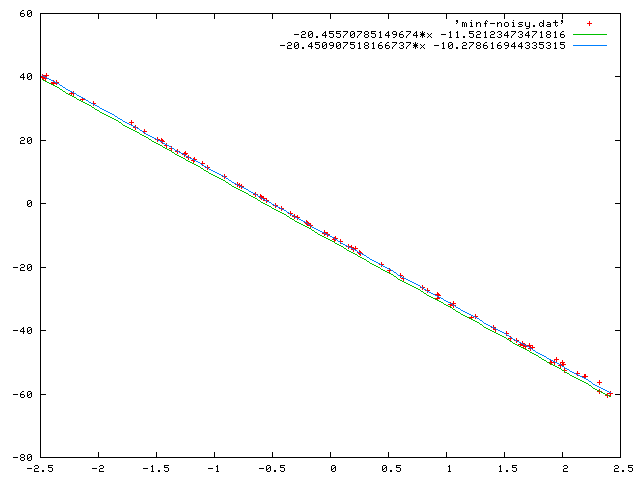
When is this type of curve fitting better than the usual least-squares methods? It is more stable in numerical applications such as quadrature near singularities (where singularities is taken in the sense of the model which the best fit is being made to). Rather than the model being taken to extreme parameter values to fit the data along the x-axis, the model remains almost the same, with very moderate effect on the constants used for curve fitting.
For example, consider data which is measured from a source y = -20x - 10, with 5% random noise.
perl > minf-noisy.dat
@x = map(rand()*5-2.5, 1..100);
@y = map((-20*$_ - 10)*(1+rand()*.05), @x);
print map("$x[$_] $y[$_]\n", 0..99);
^D
where ^D indicates Control-D.
We can get the x-coordinates and y-coordinates and then use LSR to obtain the traditional curve-fit.
y_lsr = -20.450907518166737x -10.278616944335315, F(y_lsr) = 0.4187396410417806.
On the other hand, the equations we get from this method are y_minf = -20.45570785149674x -11.52123473471816, with F(y_minf) = 0.048651734263072746.
# x-coord
cut -f 1 -d ' ' minf-noisy.dat | line | sed 's| |, |g' | wrap 0
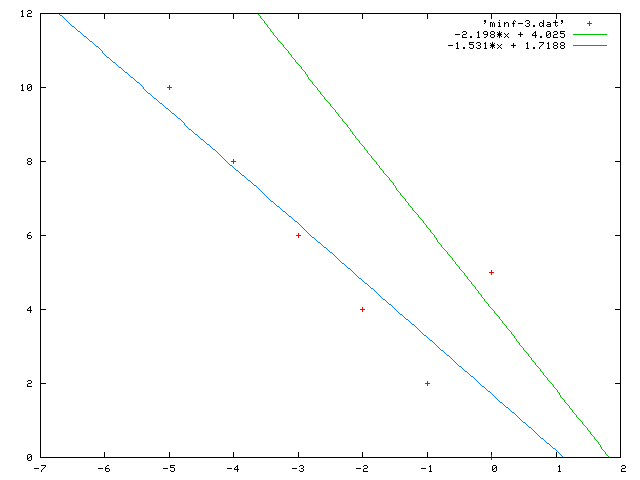
A clearer example:
(For an ordinary regression line, go to lsr.)